A few weeks ago I found myself thinking about a run I'd uploaded to Strava and considering a slightly uncomfortable question: How well does Strava actually hide where I live?
I've always assumed the answer was reasonably well. After all, that's what the “privacy zone” is for - blur out the start and end of your activities, protect your home and keep the internet from triangulating your front door.
But the more I thought about it, the more the question bothered me. Because if someone really wanted to work out where I lived from Strava, how hard would it actually be? That thought, half curiosity, half concern, sent me down a rabbit hole. A rabbit hole of generating routes, uploading endlessly to Strava, some light abuse of OSMnx and a frankly unreasonable number of GPX files.
And the results? Well they did surprise me. (If you rely on Strava's default privacy settings, they'll probably surprise you too.)
In this post I'll explore how Strava's privacy zones work, how you could reverse-engineer them and what happened when I tried.
What Are Strava's Privacy Zones? (And Why They Matter?)
Before diving into how I reverse-engineered them, it's worth understanding what a privacy zone is on Strava.
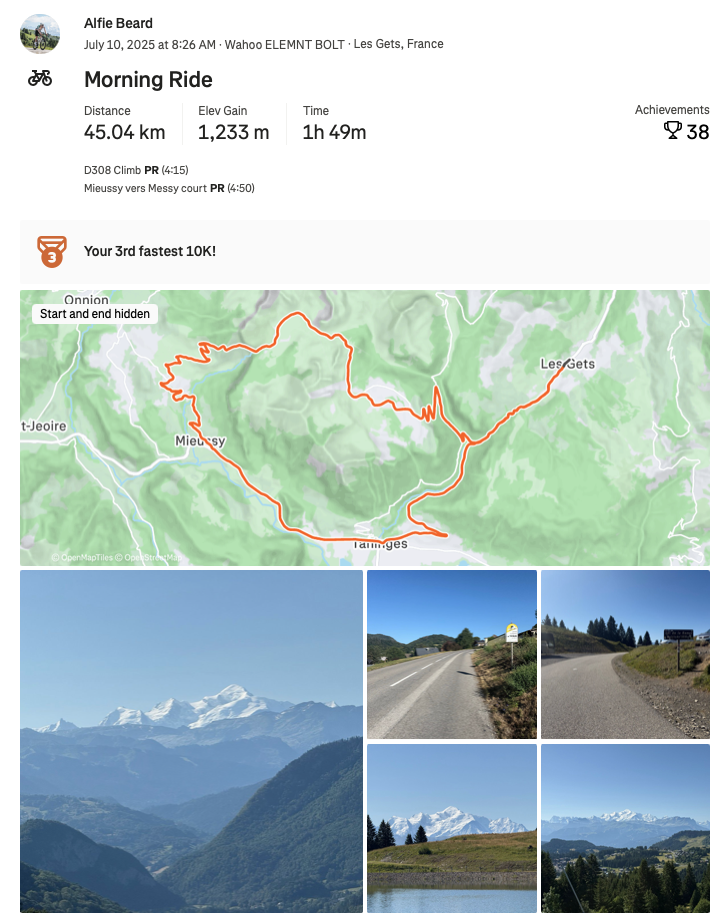
Firstly, for the uninitiated, Strava is an activity tracking app that allows users to track activities, think running, cycling, swimming, hiking, etc., and share them with others. These activities include GPS information of where the activity took place and it's route, which introduces privacy concerns.
Strava takes this seriously introducing the latest version of their privacy zones back in 2021. In theory, it's simple: draw a circle around your home or workplace, and any activity that starts or ends inside that circle has the first chunk of GPS data hidden. Segments that start inside the zone get hidden too. Otherwise someone could just scroll your list of recently completed segments and spot the one that appears at the top of every activity and deduce your front door with embarrassing accuracy.
By default, Strava sets that circle with a radius of 200m. You can stretch it up to 1.6km if you're extra cautious. On paper, that sounds pretty robust. A neat, easy way to blur out your most sensitive locations.
But here's the catch: If someone sees enough "start points" and "end points" clustered around the edge of that circle, surely this could display a pattern that may recover the true start location of your home.
This is the whole reason I started digging.
Why Try To Reverse-Engineer This?
A few reasons - some practical, one slightly more adventurous:
-
Understanding: I wanted to see how the privacy zones behave in the real world. Not the conceptualised ideal version, but the messy version that interacts with real activities, real places and real life.
-
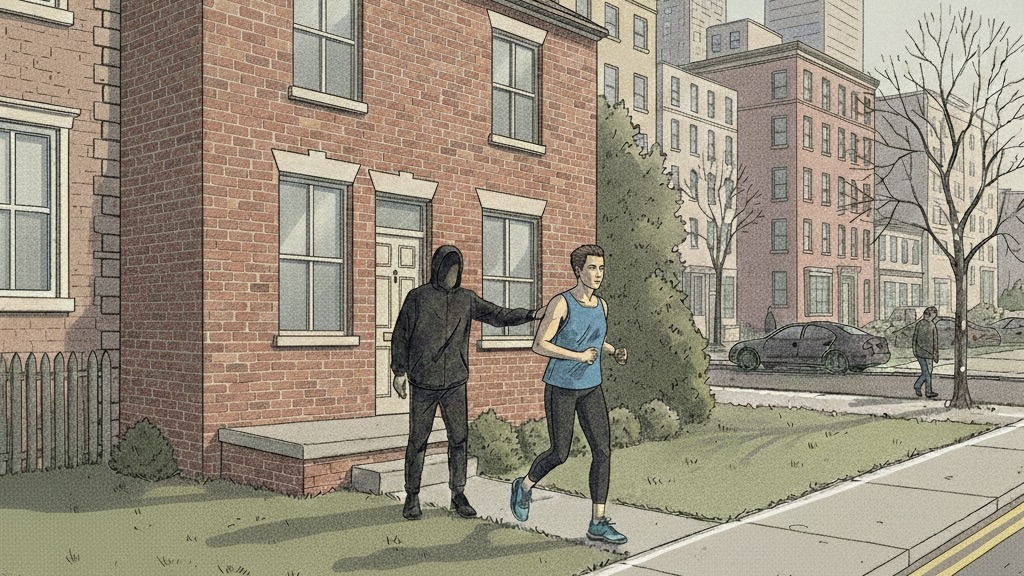
Awareness: There are documented cases of thieves using Strava to commit crimes. Other people could use this for nefarious purposes too. If privacy zones turn out to be weaker than people assume, it's better to know than to assume everything is fine.
-
Curiosity (ok, mostly this): Once I realised it might be possible to "unmask" a true starting location, it became a technical puzzle to solve.
Technical Setup
To figure out whether someone could locate a user's true start location on Strava, I needed two things:
- Lots of activities, all starting from the same location
- These same activities with Strava's privacy zone applied
Once I had both datasets, I could compare them and see how close you can get to the hidden start using different methods.
Generating The Routes
First, I needed realistic sample activities. I wrote a route generator that pulls in the street network using OSMnx and models it with NetworkX. Each route begins at the same origin, then wanders outward through a series of semi-randomised waypoints pointing roughly in the same direction (±60° variation and ±30% distance variation).
This isn't meant to be perfect. Real human activities aren't perfect either, especially in dense cities with patchy GPS and awkward street geometry. The goal wasn't accuracy - it was plausibility.
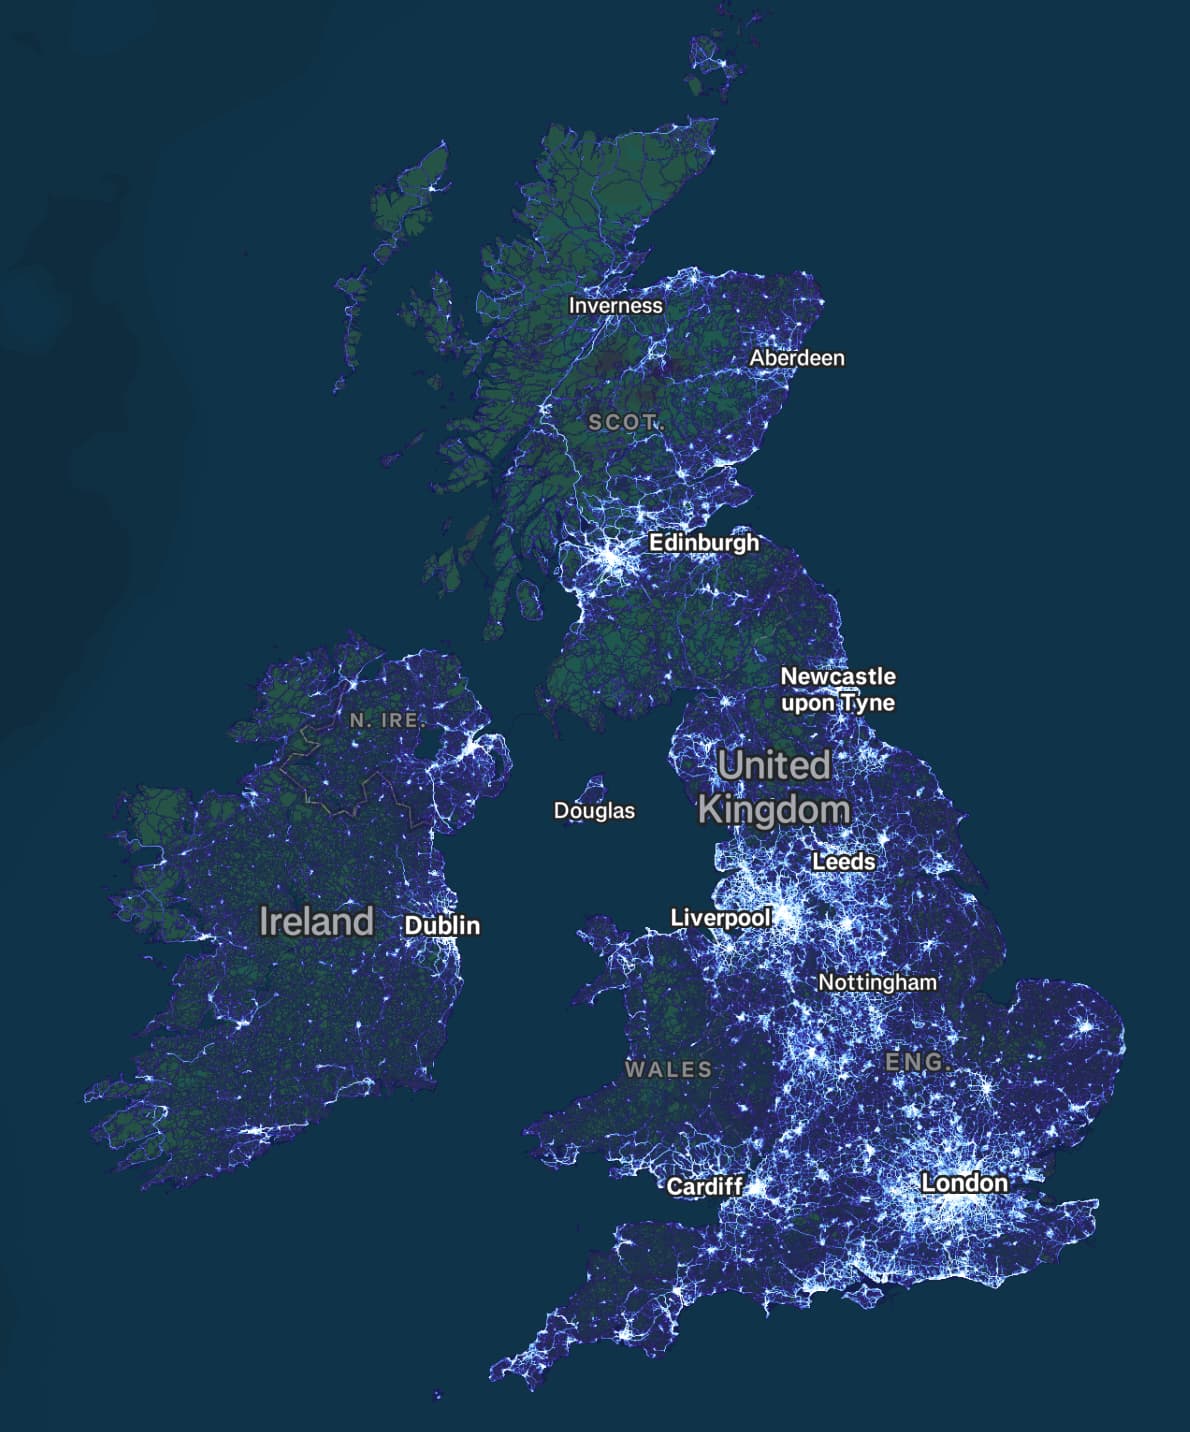
I chose London as the test area for two reasons:
- Over 80% of the UK population lives in urban areas.
- Strava's own UK heatmap shows massive concentrations of activity here.
40 routes later, I had a solid dataset: varied, messy and close enough to real world activities to reveal patterns.
Applying Strava's Privacy Zones
This part was less elegant.
Strava doesn't expose an official "apply privacy zone" function - everything happens on upload. So I uploaded each activity to a fresh Strava account using their upload API, waited for Strava to process it (rate limits make this a surprisingly patient exercise), and then downloaded the GPX versions from a separate, unconnected account.
Those downloaded activities include Strava's default privacy zone - exactly what a stranger would see.
The result was a clean before/after dataset:
- Original activities from the true start location
- Privacy-filtered versions with hidden starts
Visually, even just eyeballing the map, I could already sense that the "hidden" location wasn't as hidden as it should be.
How Could You Reverse-Engineer a Strava Privacy Zone?
Once I had the before/after datasets, the big question was simple: If someone wanted to estimate the true starting point, how close could they get?
There are a few approaches you could try - from the embarrassingly simple to the disturbingly effective (and sometimes both).
Let's walk through them.
Simple Average Method
I start with the simplest possible approach, just averaging all the activity start points. Essentially take every activity "start" coordinate, average the longitudes, average the latitudes and call the result a prediction.
That's it. Nothing complex.
It works well when the start points are nicely spread out - which they typically are in a city, like I have here - but it's obviously vulnerable to anything skewed: a bunch of activities all starting in one direction, or several outliers.
The results are below. The true start is the blue X; the average estimate is the white X.
For something this trivial, a prediction within 29.9m of the true start location is both impressive and a little unsettling. Almost anyone could do this in a few lines of code (or a spreadsheet!).
Boundary Method
Averaging works nicely here, but you can imagine situations where it fails - for example, if nearly all activities emerge on one side of the home, the average will drift toward the busiest direction.
One way to dampen that effect is to draw the smallest convex polygon that contains all the start points. Think of it as shrink-wrapping the cloud of points without letting the outline bend inward. Once you have that polygon, take its geometric centre. Because the hull ignores interior points, clusters don't pull the centre as hard.
I built the hull using scipy.spatial.ConvexHull, which implements Qhull. I won't explain this in full here, but it's essentially: start with a
triangle, keep expanding the hull whenever a new point lies outside it, and stop when no more can be added without bending the shape inward.
It's a little worse than the Simple Average Method here (the points are very evenly distributed), but it's still another independent route to a prediction - and only ~37 m off.
Circle Fit Method
The convex hull helps with uneven distributions, but it's vulnerable to significant outliers (just like the Simple Average Method) - especially those that jut far outside the main cloud of start points.
There's a small example of that in this dataset: a single start point on the right side sits noticeably further out than the rest. Because the hull must include it, the polygon stretches to accommodate that point, pulling the centre with it.
A circle fit avoids this. Instead of wrapping a polygon around the outside, I fit a circle through the points - which tends to ignore both interior and exterior outliers. We also know that Strava privacy zones are circles, so trying to find that circle makes sense.
I used RANSAC, a robust fitting algorithm designed to handle messy data, to fit the circle. The idea is simple: instead of trying to fit a circle to all the start points at once (where outliers could ruin the result), RANSAC repeatedly takes small random subsets of the start points, fits a circle to each subset, and sees how many of the other start points fall close to that circle. After many iterations, it keeps the circle that is "supported" by the most start points. In other words, it automatically ignores the "weird" start points while focusing on the main cluster.
Once the circle is fitted, its centre becomes the prediction.
It performs better than the polygon here, and visually you can see why: that one distant right-hand point influences the centre far less.
Donut Overlap Method
The previous methods treat all the start points as a cloud and try to summarise the whole shape. This method flips the idea: instead of one overall geometric structure, I build a constraint for each start point.
Here's the logic. If Strava hides the first ~200 m of each activity, then the real start must lie somewhere on a ring around each public start point: too close is impossible (because that's near the edge of the privacy zone), too far is also impossible (because the privacy zone is fixed in size). There's a Goldilocks zone, where the true start location lies.
So for every start coordinate, I draw a donut - an inner radius and an outer radius - representing the region in which the true start location lies in. Donuts instead of perfect circles allow for small variability in how Strava trims each route.
To choose the donut radius, I reuse the circle-fit from the previous method: take its estimated radius (which is a decent approximation of the privacy zone radius) and scale it down slightly (0.92 here) because RANSAC tends to overestimate it a little, likely due to Strava's processing of the activities.
Then:
- Create a grid covering the area.
- Count how many donuts overlap each grid cell.
- Find the cells with the highest overlap count.
- Use DBSCAN to cluster those "hot" cells.
- Predict the start location by taking the weighted centre of that cluster (weights = number of overlaps).
This method produces an actual visual hotspot that often narrows down the plausible region quite intuitively.
It edges out the Simple Average Method, just - and gives you a more forensic feel, you can literally see the "hot area" emerging from the overlaps.
Adaptive Donuts Method
The Donut Overlap Method works well, but it assumes the privacy zone radius is the same for every activity. In reality, Strava may introduce some variability - whether intentionally or because GPS and activity processing create slight differences (I'll cover this more in a future post).
The Adaptive Donuts Method accounts for this by estimating a custom donut radius for each activity. Here's how:
- Compare the total activity distance shown on Strava (which includes the hidden data) to the distance of the downloaded GPX after privacy trimming.
- Apply a scaling factor (0.78 in this example) to compensate for Strava's processing of the activities.
- Draw a donut around each start point using its own radius.
- Overlay all donuts, count overlaps on a grid, cluster high-overlap cells with DBSCAN, and compute the weighted centre of the resulting cluster, just as before.
This results in a hotspot tuned to the slight variability in each activity's privacy zone, rather than assuming every activity has exactly the same privacy zone.
Interestingly, this is slightly worse than the Donut Overlap Method here. The per-activity radius estimates perhaps introduce a bit more noise than they remove. But it's still very precise, and the visual hotspot is even more informative than previous methods.
Overview of Results
Here's how all methods stack up:
| Method | Distance Accuracy |
|---|---|
| Simple Average Method | 29.9m |
| Boundary Method | 37.4m |
| Circle Fit Method | 33.9m |
| Donut Overlap Method | 28.5m |
| Adaptive Donuts Method | 31.0m |
A few takeaways:
- No method is dramatically better than any other; each has strengths depending on the start point distribution.
- The average of all predictions is surprisingly strong: 23.3 m from the true start. Combining approaches produces a result even more precise than any single method.
- And perhaps the scariest part: the simplest method - just averaging the start points - is extremely effective.
In a dense UK city centre, these distances narrow the possible start location down to within 2-4 houses on a typical street.
To put this into context, we can put this into Google Streetview. This is the view looking out from the true start location (home) to the start location predicted by the Simple Average Method. This is striking - from all those different start locations 200m away, it's possible to get this close to the true start location. This is terrifying. Really.
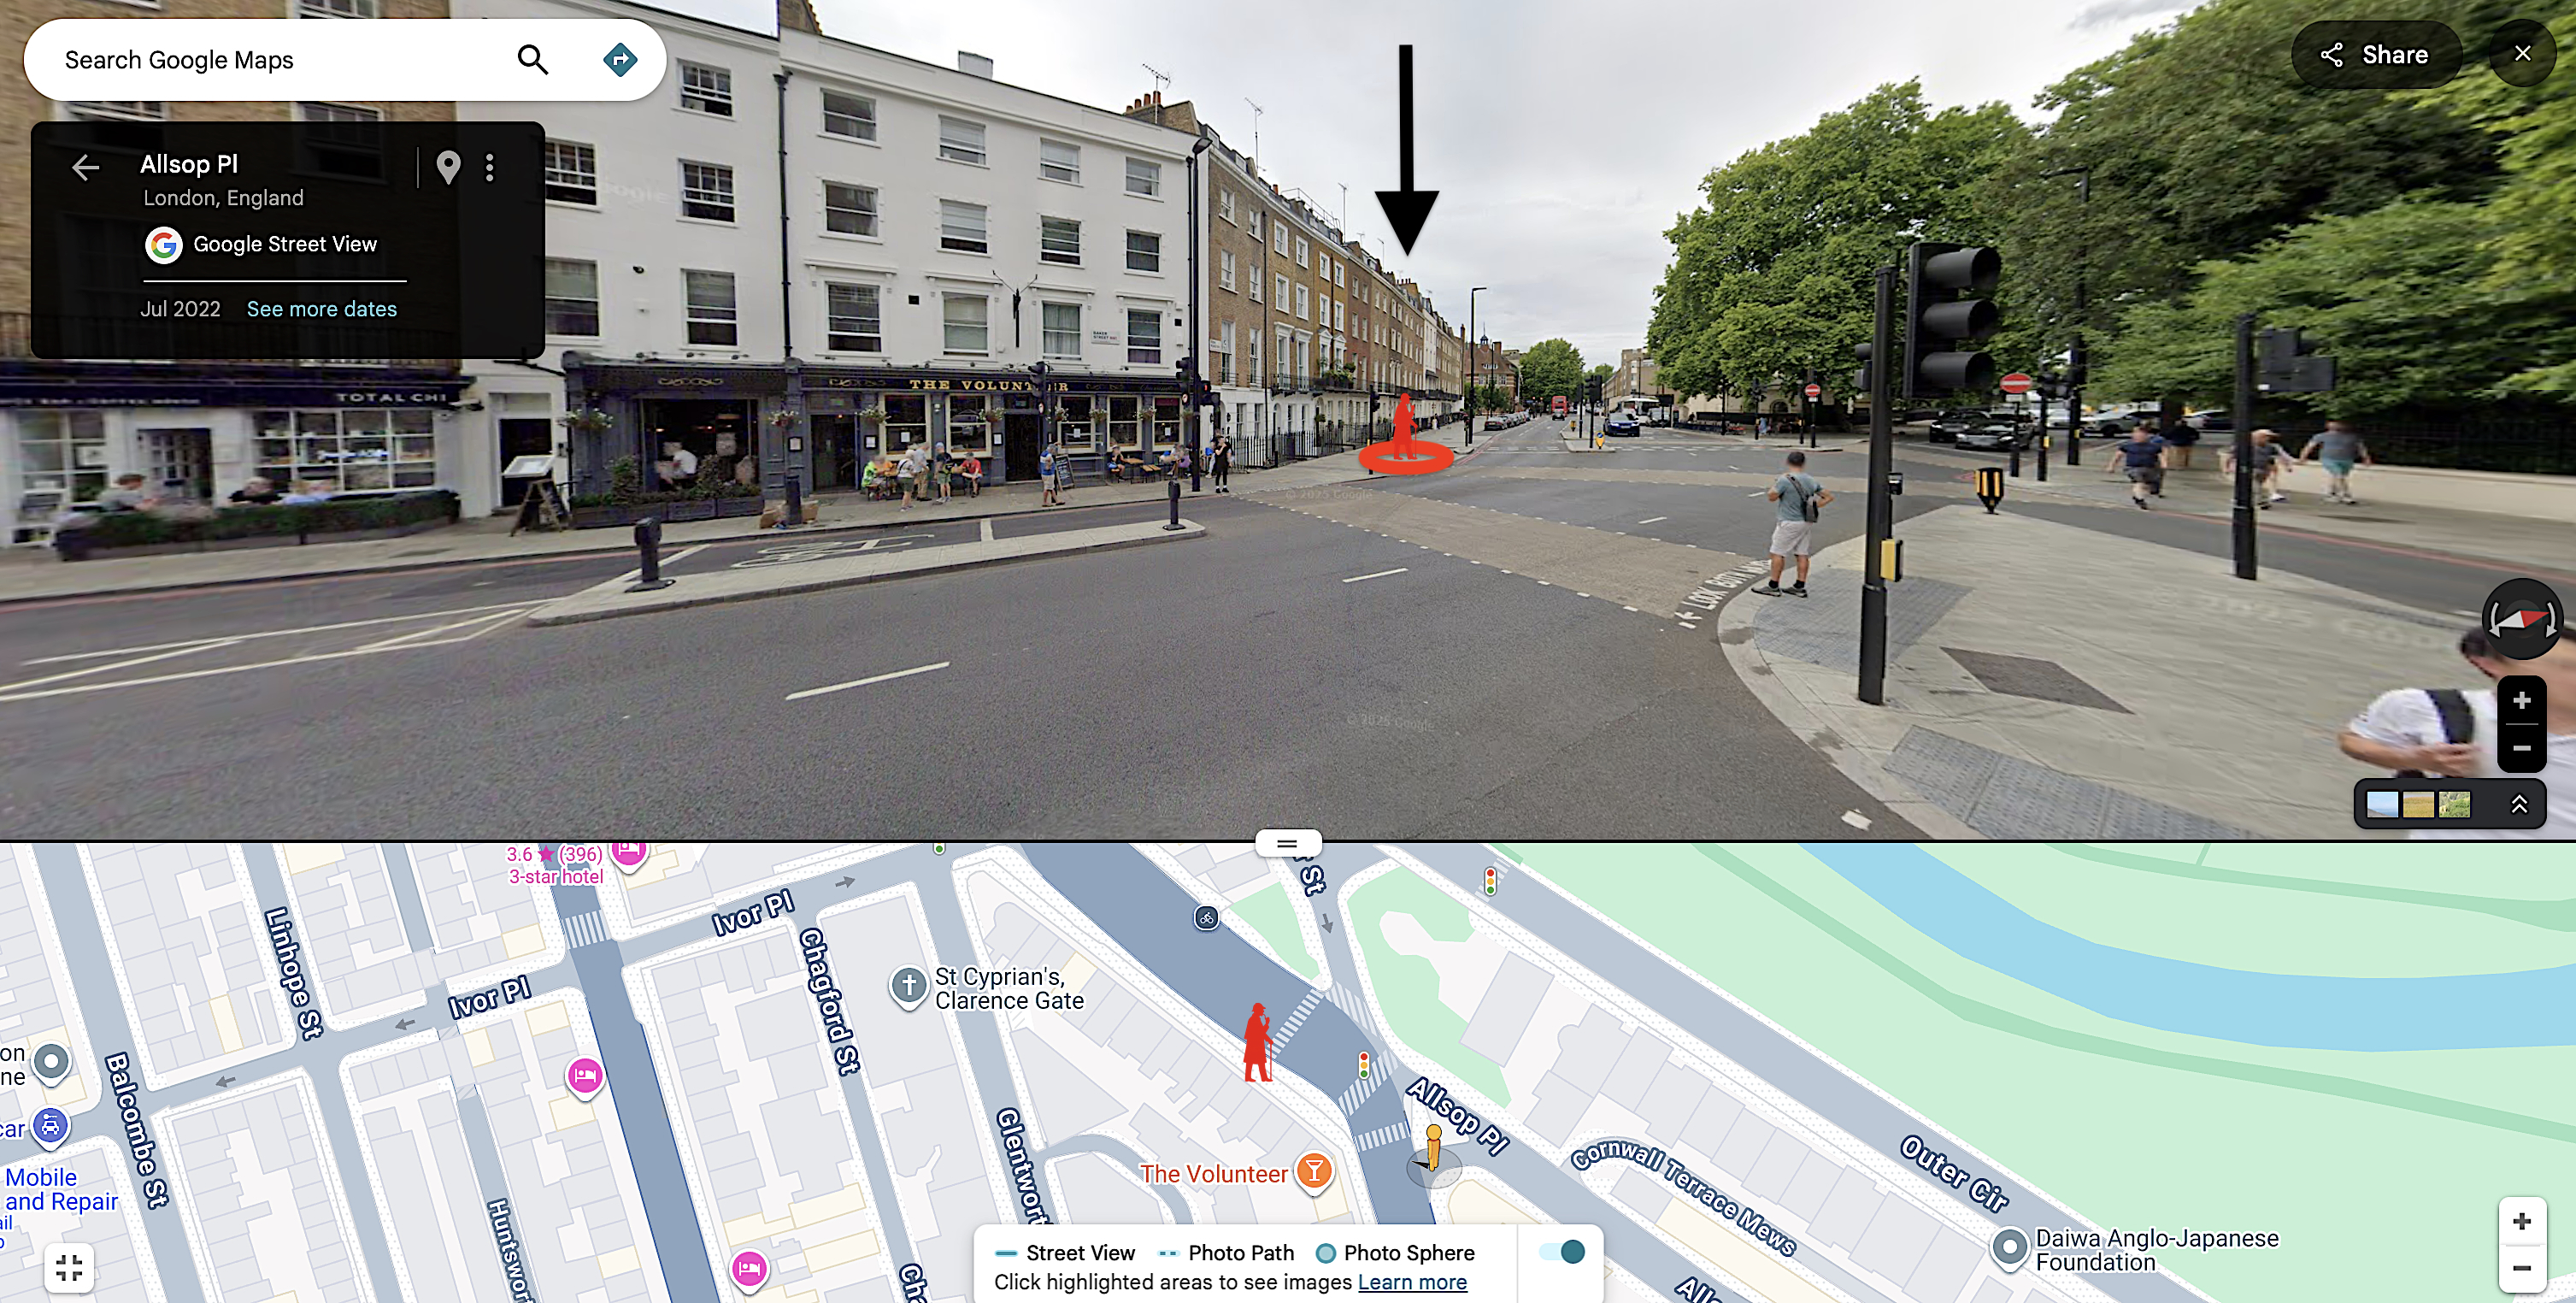
It's worth pausing: the simplest, most naive approach already gets this close. All the clever geometry, donuts and clustering add layers of complexity, but the average alone is already surprisingly - and somewhat unsettlingly - effective.
Wrapping Up - What This Means (And What's Next)
This is obviously the smallest possible sample: one start location in one city, with a fairly diverse set of activities. Even so, the results are both surprising and unnerving.
Of course not every location will have the same density or variety of activities. In this case, I used a fairly well-distributed set of start points. In other areas, activities may be more constrained - fewer streets, empty spaces like parks or lakes - which could reduce the spread of start points and make predictions harder.
However, in a dense city, someone could plausibly figure out where you live, almost down to the house. Not exactly private - and that's the default setting in Strava - a far cry from the 200m everyone is probably expecting.
You could go further if you really wanted to. I haven't factored in street layout or traffic patterns here, but this basic approach already dramatically narrows the possible start locations.
The takeaway: Strava's privacy zones, as configured by default, don't do nearly as much as most people probably think.
And yes, this required 40 activities. Could the same precision be achieved with fewer? Could just 10 be enough? I'll put that to the test next time in Only A Few Activities Can Find Where You Live on Strava.